There have been many reports regarding the connection between health, educational attainment, gender, age, race, and annual income - especially in the Bronx. According to the USDA, 1.2 million New Yorkers were food insecure in 2016, and just under 20% of the Bronx population experienced food insecurity alone. Bronxites received the highest amounts of federal assistance related to food amongst the five boroughs, including programs such as SNAP
In 2018, more than one quarter of Bronxites experienced food insecurity - way higher than the citywide average of 12.8%.
What is food insecurity??
“It is categorized by the USDA–the federal agency who provided the data Hunger for America used in its report — as “low food security” and “very low food security.” A low food security household has reduced access to quality and variety of diet, while maintaining sustainable caloric levels. A household with “very low food security” is one with “disrupted eating patterns” and “reduced food intake.” According to Hunger for America, 290,469 people in the Bronx can be placed in one of those two categories, second only to Brooklyn’s 368,799 in total population." (Norwoodnews.org)
THE BRONX BY THE NUMBERS:
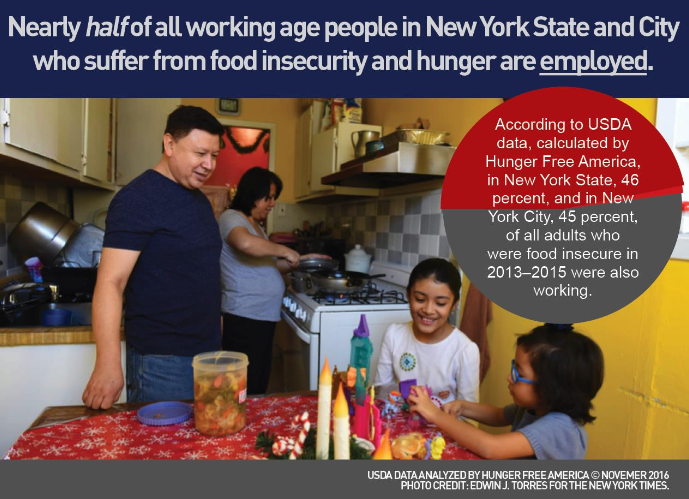
"Hunger and food insecurity continue to be serious problems affecting too many New Yorkers,
especially in communities such as the ones I represent,” I commend Hunger Free America for presenting their yearly report, which clearly indicates the work we need to do across all levels of Government in order to find comprehensive solutions that will help those who are struggling to feed themselves and their families.”
-State Senator Gustavo Rivera, the Bronx (2016)
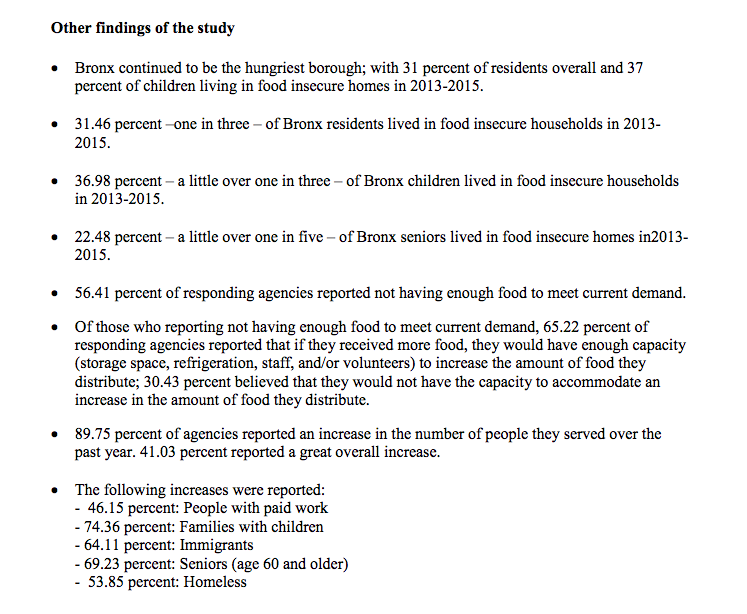
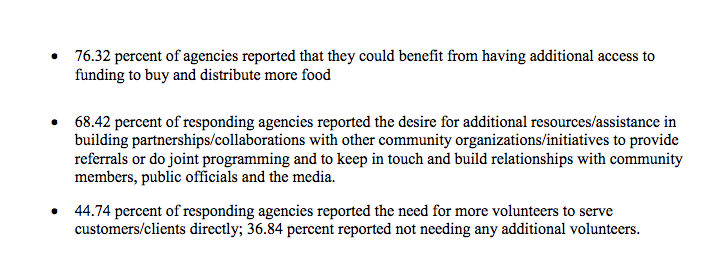
The following data is from the same report from hungerfreeamerica.org (2016)
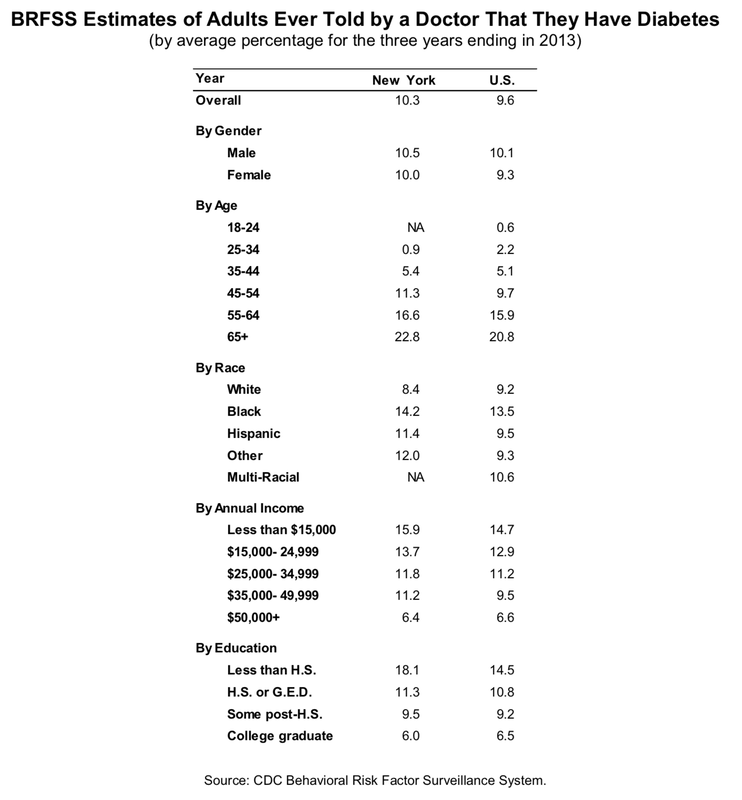
According to the CDC's Behavioral Risk Factor Surveillance System, there is high prevalence of diabetes in New Yorker's who have an annual income less than $15,000, who have less than a high school education, and diabetes. New Yorkers who survive on less than $15,000 show
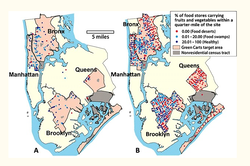 Evaluation of the Placement of "Mobile Fruit and Vegetable Vendors to Alleviate Food Deserts in New York City." nih.gov
These two graphs examine the correlation between "walk-ability predicting obesity in NYC." This means that there were more healthy food outlets in higher density areas (ex: Manhattan) vs places like the Bronx, which had lower walk-ability concentrations.
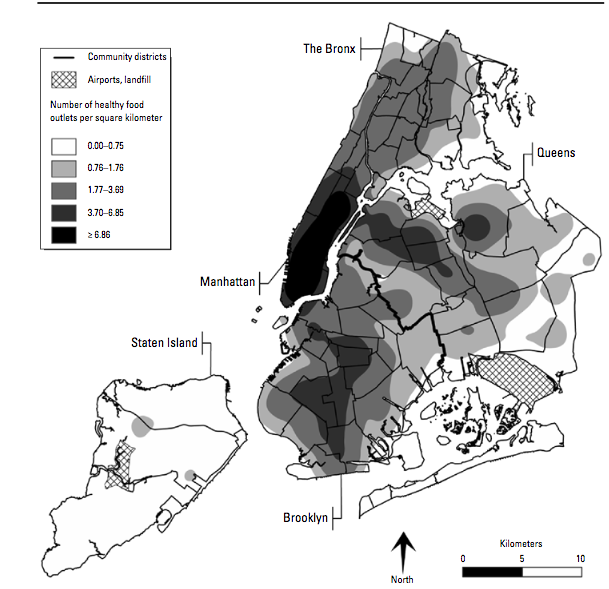
"Neighborhood Food Environment and Walkability Predict Obesity in New York City" nih.gov
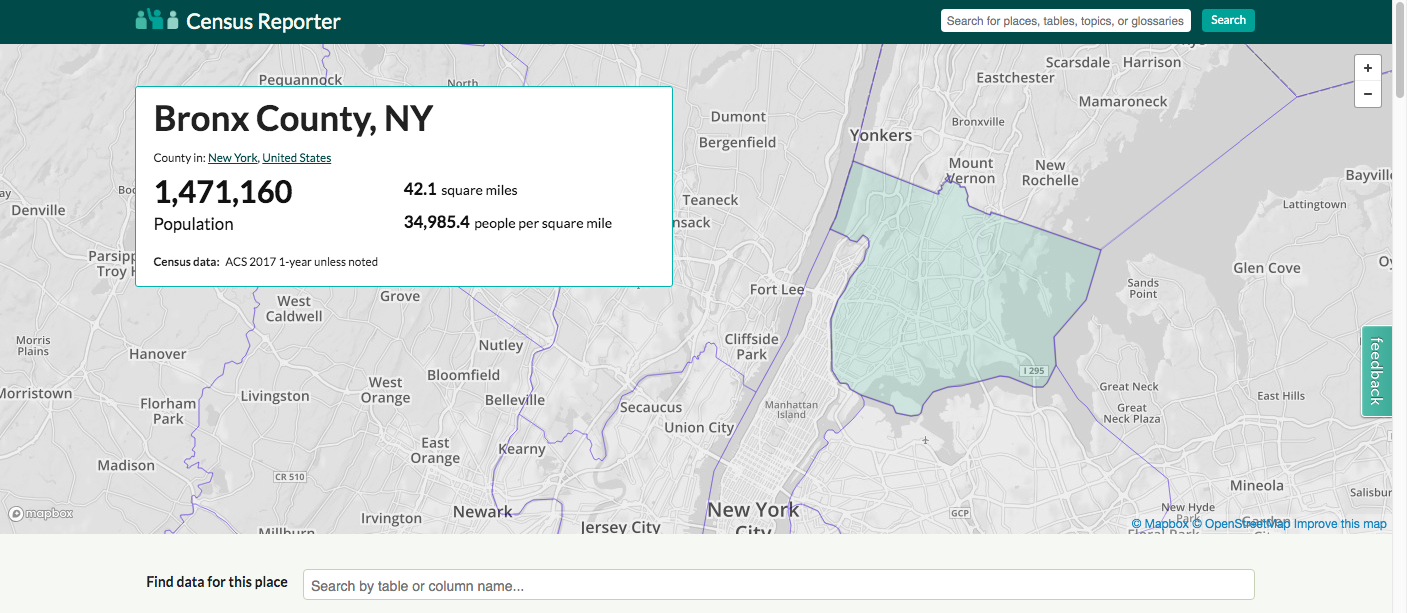
Bronx Population, 2017. Censusreporter.com